Visualizing Software Architecture using C4 Model and Python Diagrams
 Photo by Faris Mohammed on Unsplash
C4 Model
The C4 Model is a great way to explain software architecture using diagrams.
Instead of throwing the developer into a confusing jumble of boxes and lines, the C4 Model breaks down the architecture starting from the top layer down to the lowest code layer. The C4 model gets it’s name from the 4 C’s:
- Context - explain at high level what the software does
- Container - explain how various components come together in the software
- Component - explain each component in detail
- Code - explain the code implementation
For a detailed explanation, look no further than the official C4 Model website.
Diagramming tools
There are several options when it comes to creating diagrams.
One of the popular options is to create the diagrams in draw.io. This tool allows you to export your diagram as an image (say, a PNG) as well as download the diagram in a .drawio file format - which you can add to your git repository.
Having the .drawio file ensures that it is possible to make modifications in the future.
My preferred way to create diagrams is to write a python script using diagrams module.
Be sure to checkout the documentation and examples of the digrams module. It has support for tons of cloud native tools. More specifically, they also have support for the C4 Model.
Example
To see how to create architecture diagrams using diagrams, let’s take the case of hypothetical app called Lacerta. Lacerta is used by users to track their safety - by having users regularly “check-in” to confirm that they are safe. If they miss a check-in, their emergency contact person is informed - who will get in touch with the user and take further action as needed.
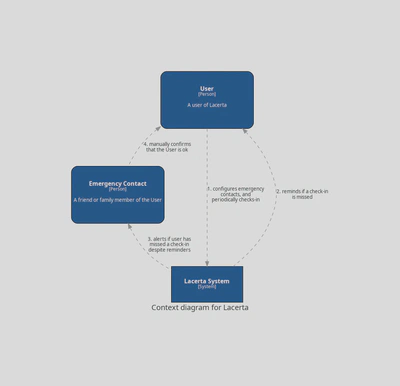
Context
At the highest level, we have the System Context Diagram:
This diagram was generated by the python code:
from diagrams import Diagram
from diagrams.c4 import Person, Relationship, System
from diagrams import Node

def main():
    graph_attr = {
        "splines": "curves",
    }
    with Diagram("Context diagram for Lacerta", filename="context", direction="TB", graph_attr=graph_attr):

        user = Person("User", description="A user of Lacerta")
        emerg = Person("Emergency Contact", "A friend or family member of the User")
        sys = System("Lacerta System", description="")

        user >> Relationship("1. configures emergency contacts, and periodically checks-in") >> sys
        user << Relationship("2. reminds if a check-in is missed") << sys
        emerg << Relationship("3. alerts if user has missed a check-in despite reminders") << sys
        user << Relationship("4. manually confirms that the User is ok") << emerg

if __name__ == "__main__":
    main()
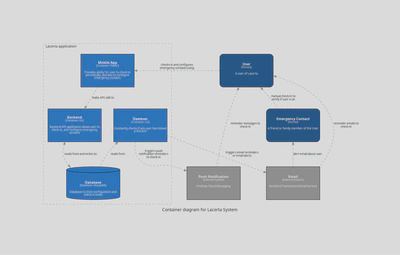
Container
At the second level, the container diagram explains how various components work together internally as well as with external systems. Here is the container diagram for Lacerta:
This diagram was generated by this Python code:
from diagrams import Diagram
from diagrams.c4 import Container, Database, Person, Relationship, SystemBoundary, System
from diagrams import Node

def main():
    graph_attr = {
        "splines": "curves",
    }
    with Diagram("Container diagram for Lacerta System", filename="container", direction="TB", graph_attr=graph_attr):
        user = Person("User", description="A user of Lacerta")
        emerg = Person("Emergency Contact", "A friend or family member of the User")
        with SystemBoundary("Lacerta application"):
            mobile_app = Container("Mobile App",
                                   technology="Flutter",
                                   description="Provides ability for user to check-in periodically, and also to configure emergency contacts")
            backend = Container("Backend",
                                technology="Go",
                                description="Backend API application allows user to check-in, and configure emergency contacts")
            daemon = Container("Daemon",
                               technology="Go",
                               description="Constantly checks if any user has missed a check-in")
            db = Database("Database",
                          technology="MongoDB",
                          description="Database to store configuration and check-in times")

        email = System("Email", description="SendGrid Transactional Email Service", external=True)
        push = System("Push Notification", description="Firebase Cloud Messaging", external=True)

        user >> Relationship("checks-in and configures emergency contacts using") >> mobile_app
        mobile_app >> Relationship("make API calls to") >> backend
        backend >> Relationship("reads from and writes to", reverse=True) >> db
        daemon << Relationship("reads from") << db
        daemon >> Relationship("triggers email reminders or email alerts") >> email
        daemon >> Relationship("triggers push notification reminders to check-in") >> push
        user << Relationship("reminder emails to check-in") << email
        user << Relationship("reminder messages to check-in") << push
        emerg << Relationship("alert email about user") << email
        user << Relationship("manual check-in to verify if user is ok") << emerg

if __name__ == "__main__":
    main()
If you look at the code, it does not look like typical imperative code written in Python, this reads more declarative - in terms of defining boxes, the lines that connect the boxes, and the direction of the arrow.
Component
I do not create diagrams at the Component level. You can, if you wish create diagrams for each component. As you get lower down the layers, you may find yourself changing the diagrams a lot during heavy development periods. So creating a diagram for the Component layer may or may not make sense for your team.
Code
You shoud almost never create diagrams for the Code layer - as we expect the code to change a lot over the lifecycle of the software. We can strive to writing clean code so its easier to read the code - or use automated tools to parse the code and generate diagrams.
Reasoning
I find that using GUI based diagramming tools gives me way too much choice - do I want rounded corners for the rectangles, or should they be sharp corners. What background color should I use for a database box, and which of the ten different arrow styles to use. It is hard to stay consistent when creating many diagrams. With code based diagramming tools, a lot of that choice is taken away from me - so I can focus on which component interacts with which component, and in what way.
Creating diagrams using code allows me to commit both the diagram, and the source code into a git repository - bringing it under version control. If a question arises in the future about when a certain architectural change was introduced, we can easily figure this out using
git logandgit blame. (See also: Architecture Decision Records)